
Channel Analytics
Channel Analytics allows you to gauge the performance of your experience across the different channels that you choose to launch on. This dashboard uses data collected from all of the launch urls created for each unique channel. The more launch urls that you create and share, the more granular your performance insights become.
Step by Step Guide
As long as you've created launch links across all of your channels, the following dashboard will be useful for you.
Navigate to “Channel Analytics” within an individual experience using Reporting > Experience Analytics > Click on an Experience > Channel Analytics.
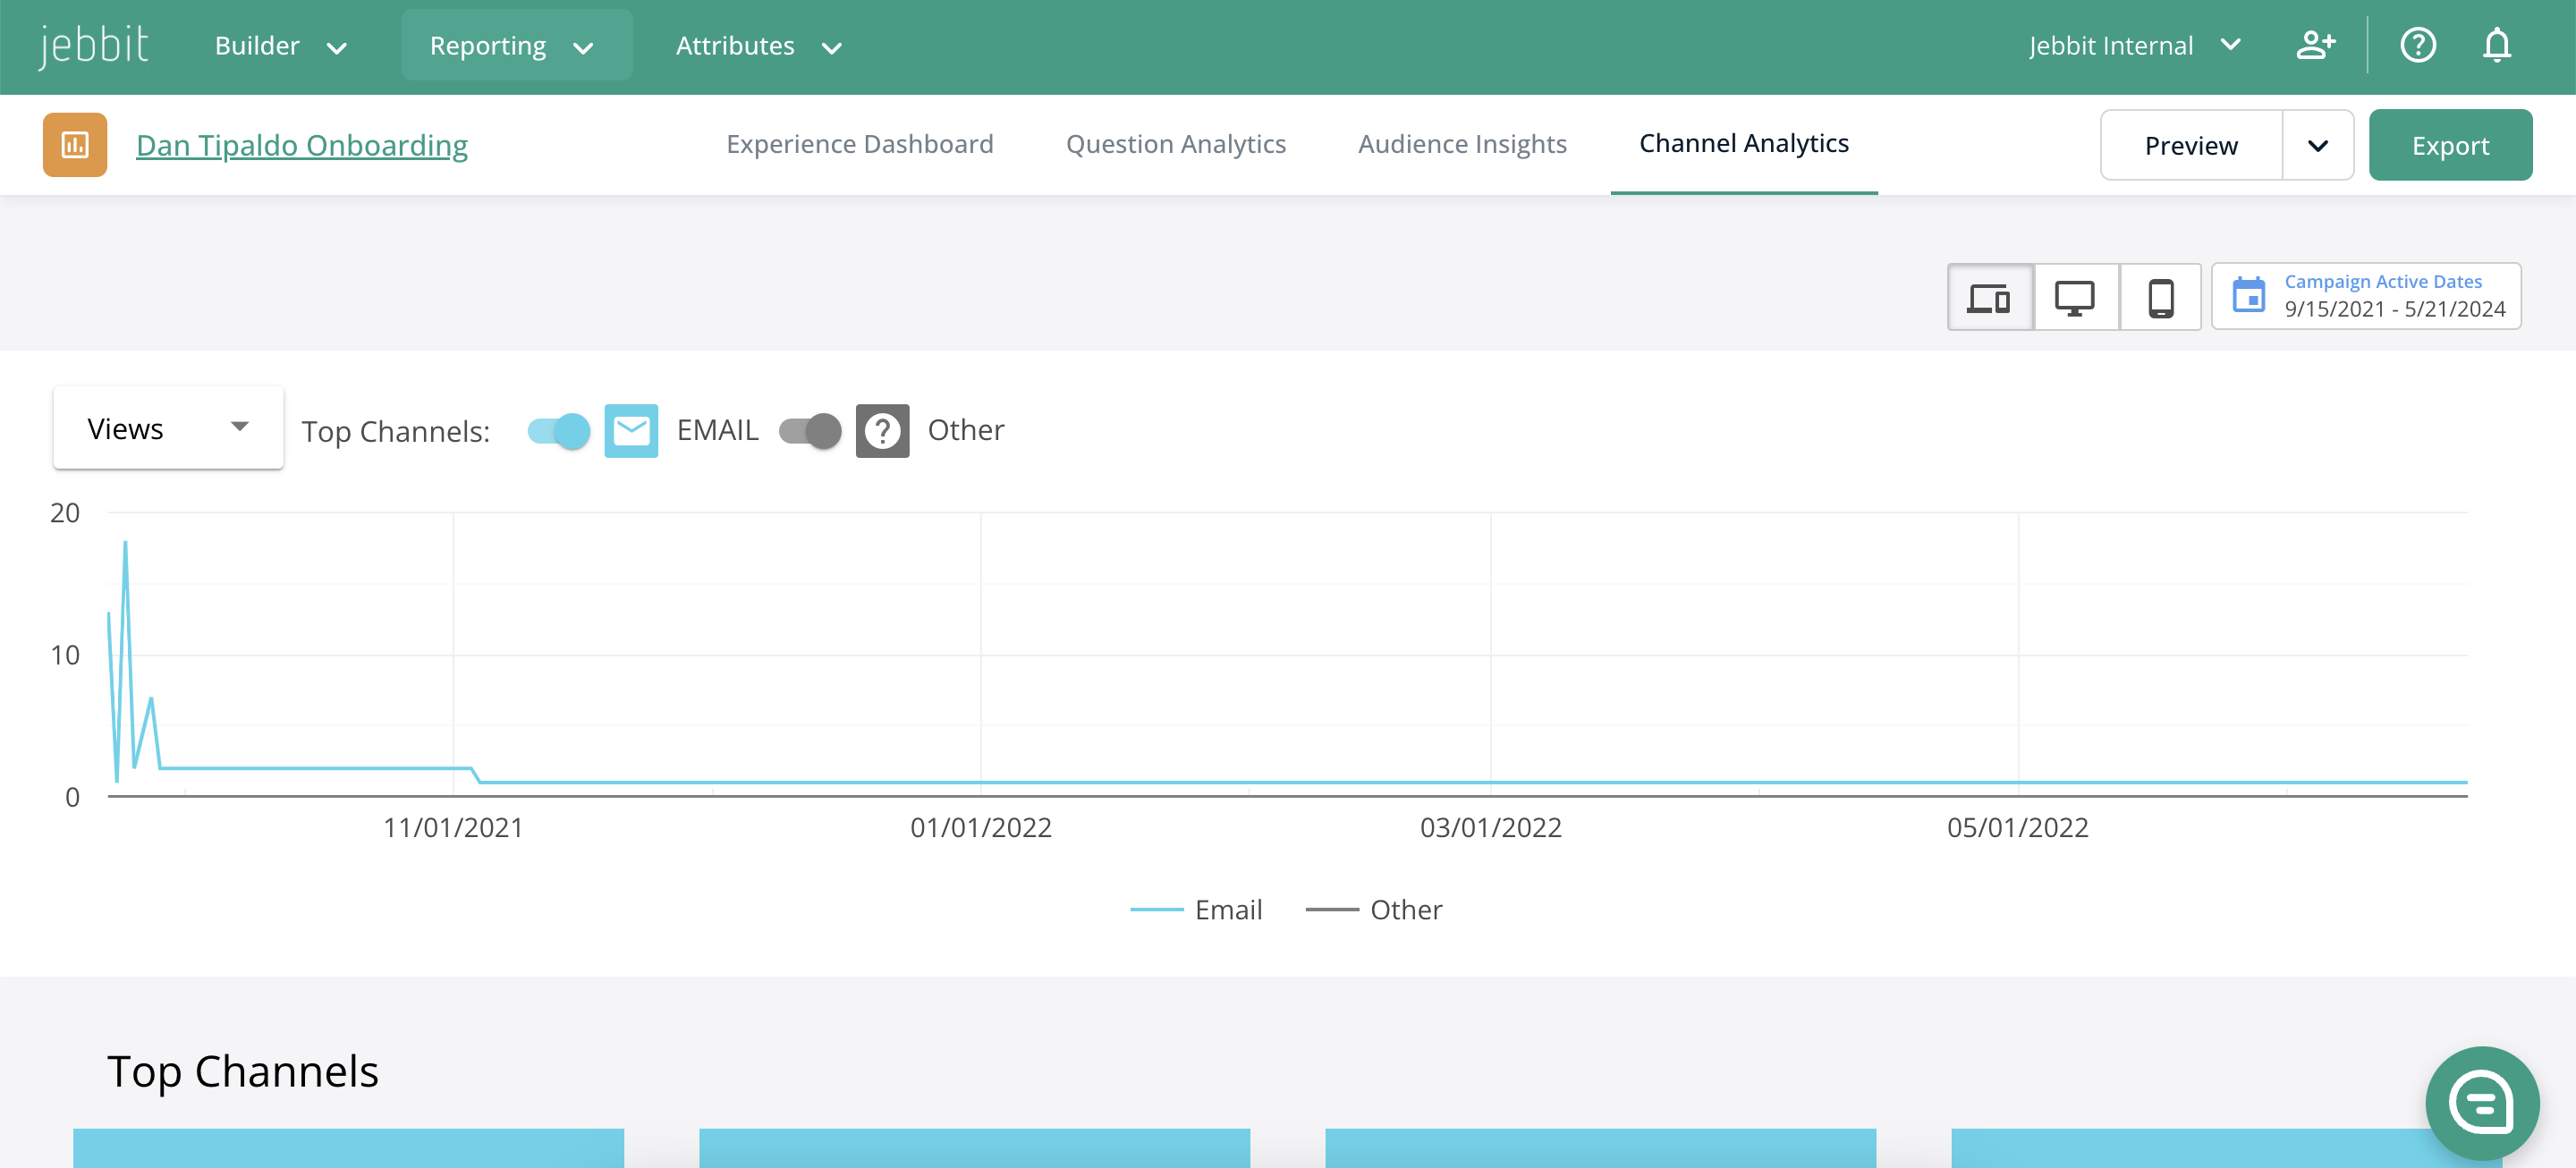
The default view is a line graph that depicts the number of views for the active duration of the experience.
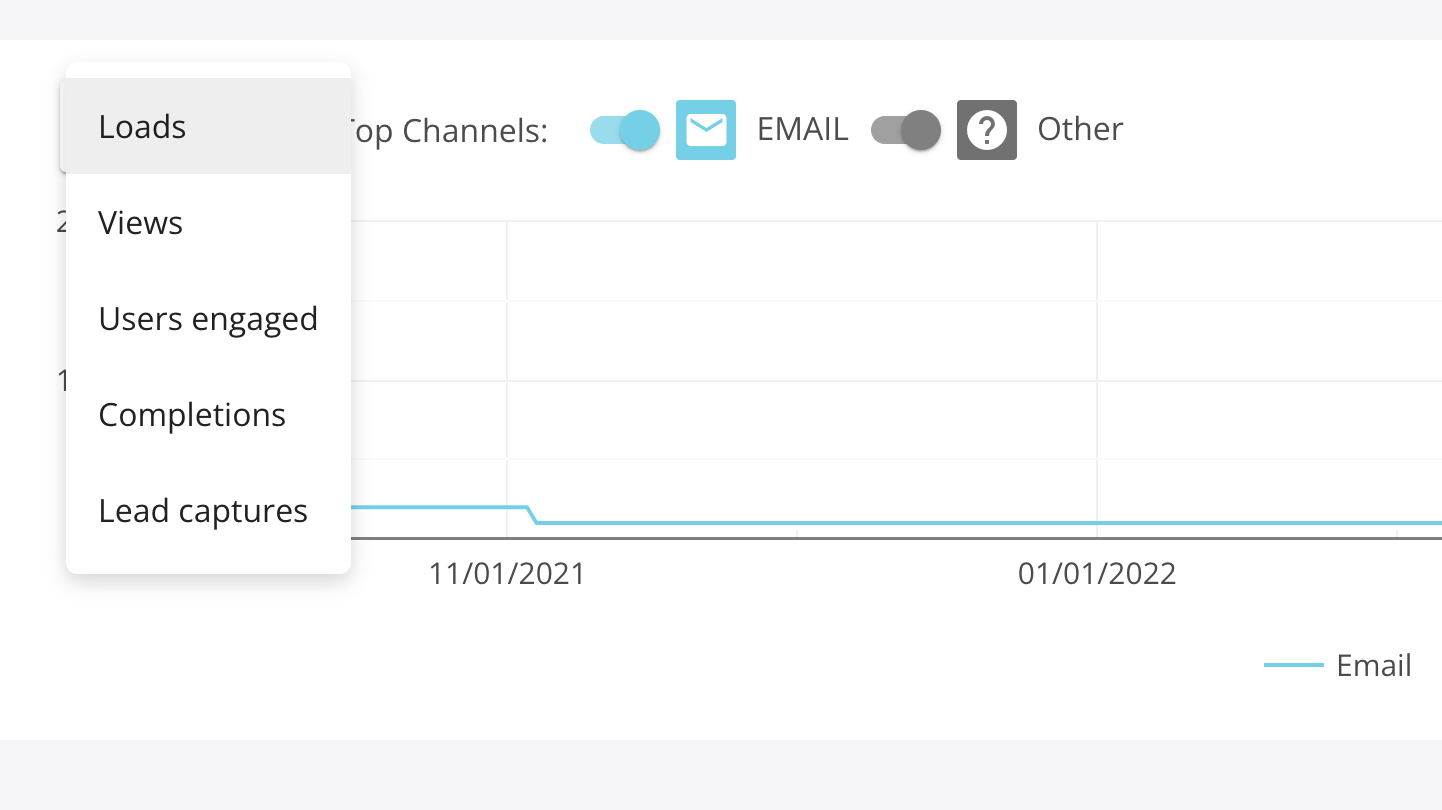
To change the view, click on the dropdown to see graphs for other metrics such as Users Engaged, Lead Captures, and Completions.
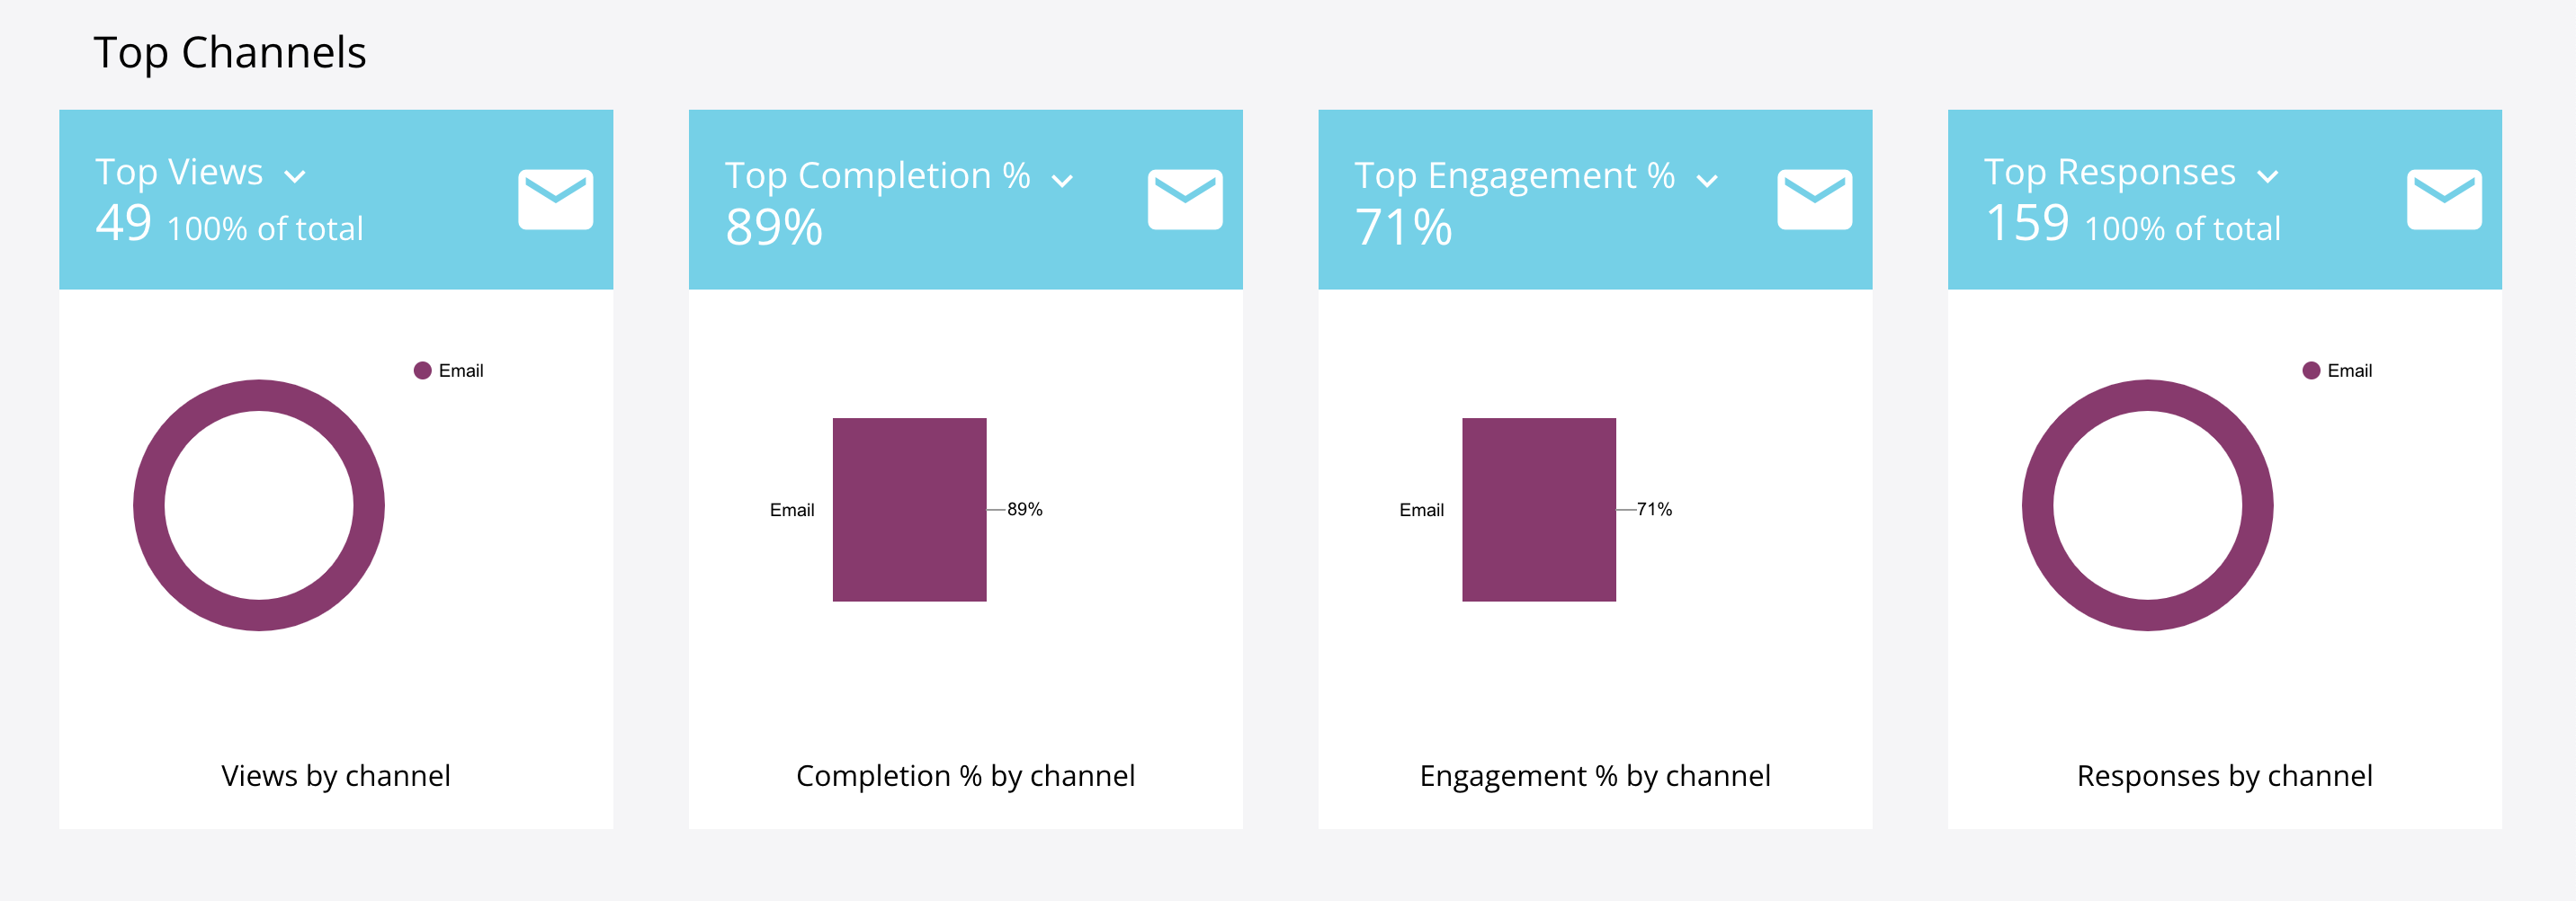
A percentage breakdown of Top Channel performance on four parameters (Views, Lead Capture, Engagement, Responses) can be viewed as a graphical representation in form of bar graph and pie chart.
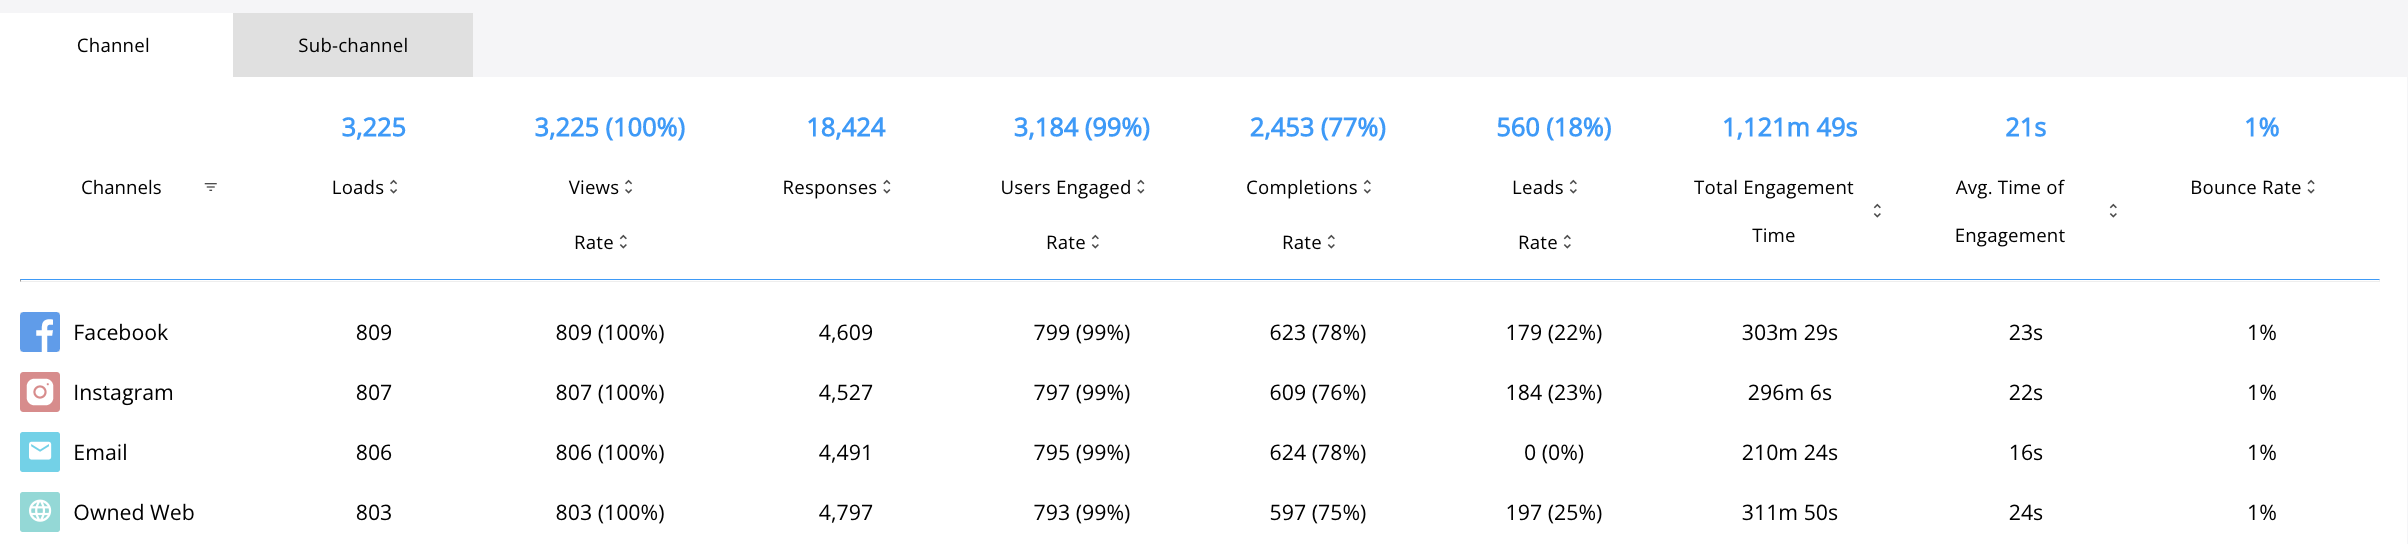
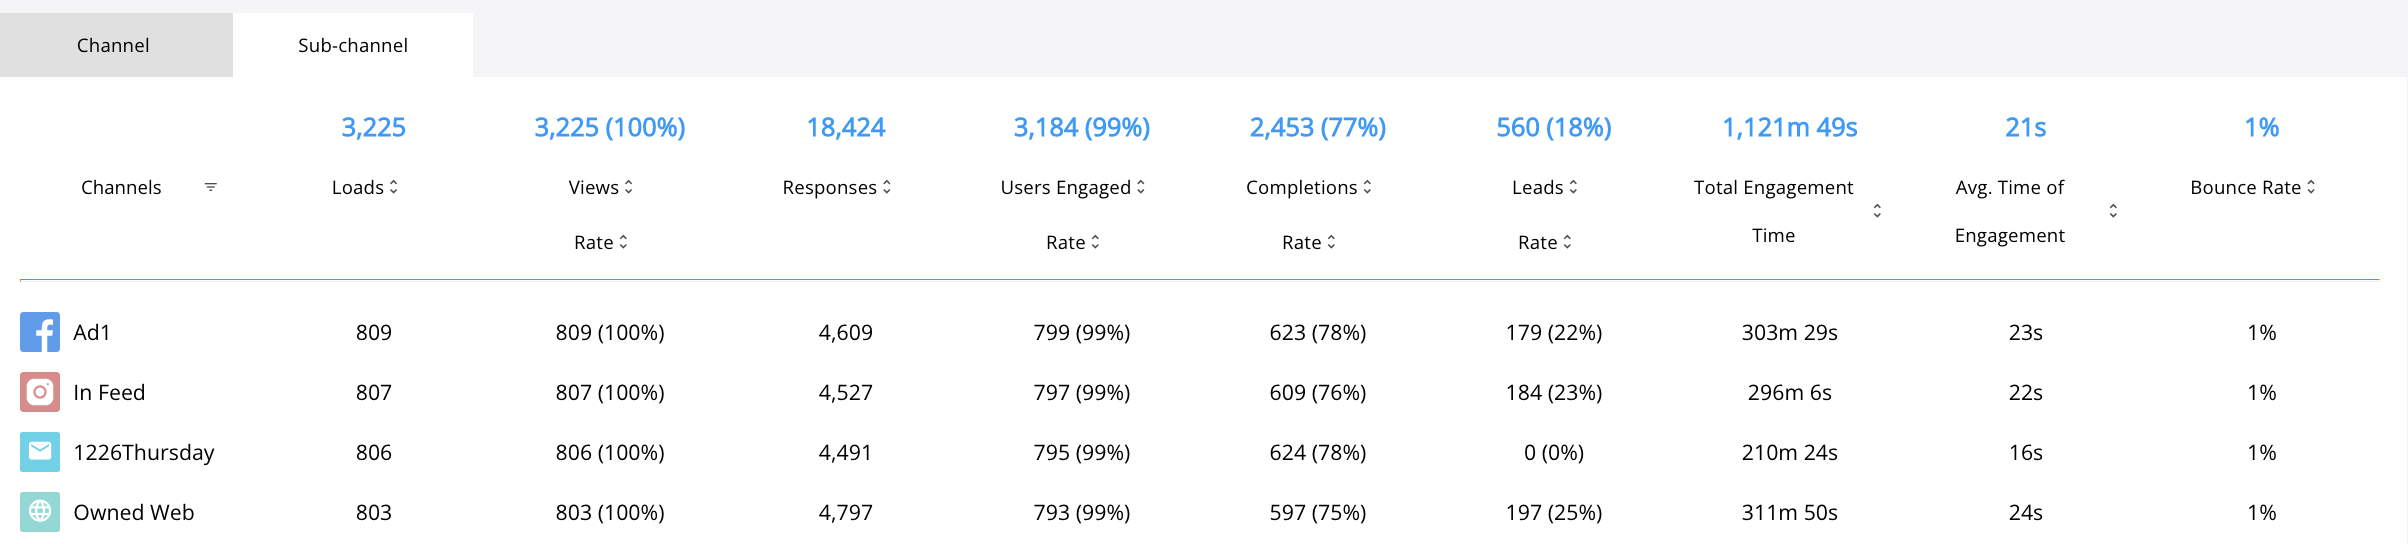
Scroll down to the bottom of the page to find a detailed account of nine key performance indicators for the Channel and Sub-Channel (different launch links created for a channel).
Related Articles
Keywords: channel analytics, channel performance, launch link