
Question Analytics
Question Analytics offers that deeper level of insight you are looking for when you see great high-level metrics but want to know about users’ answers to individual questions - at what rate they respond and how they answer.
Step by Step Guide
Navigate to “Question Analytics” within an individual experience.
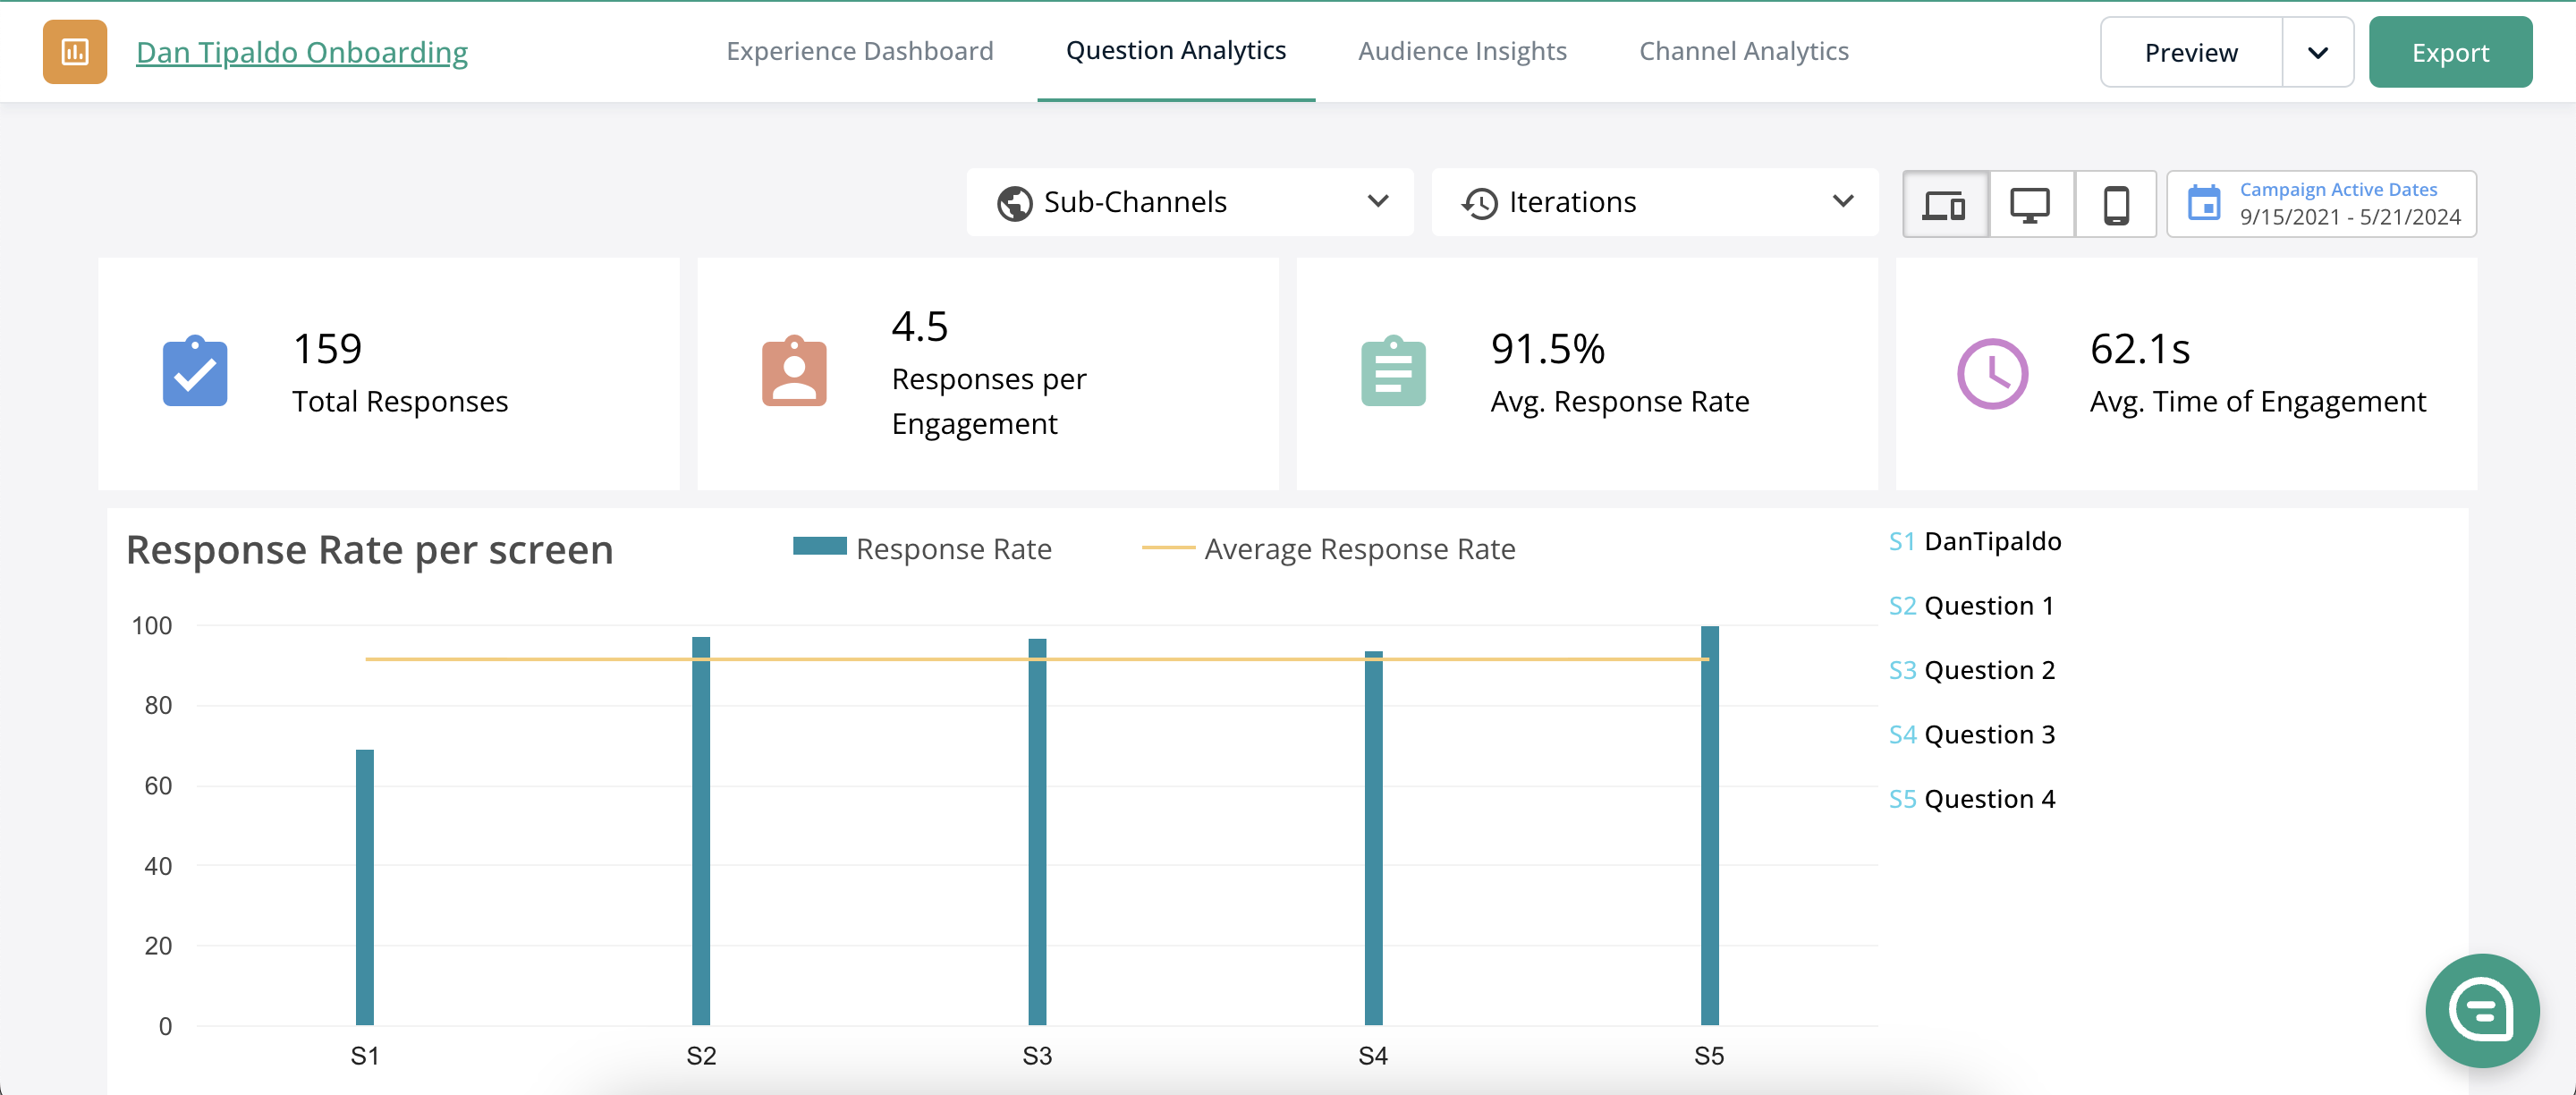
At the top of the page, you can filter the data by Channel, Experience Iteration (if any changes or optimizations have been made), device, and date.
Response rate is the percentage of users that have responded to a question. The response rate across an entire experience is represented by a yellow line, while individual questions’ response rates are represented by vertical blue bars.
If the response Rate on a screen dips below the average response rate, this may present an opportunity to optimize that screen.

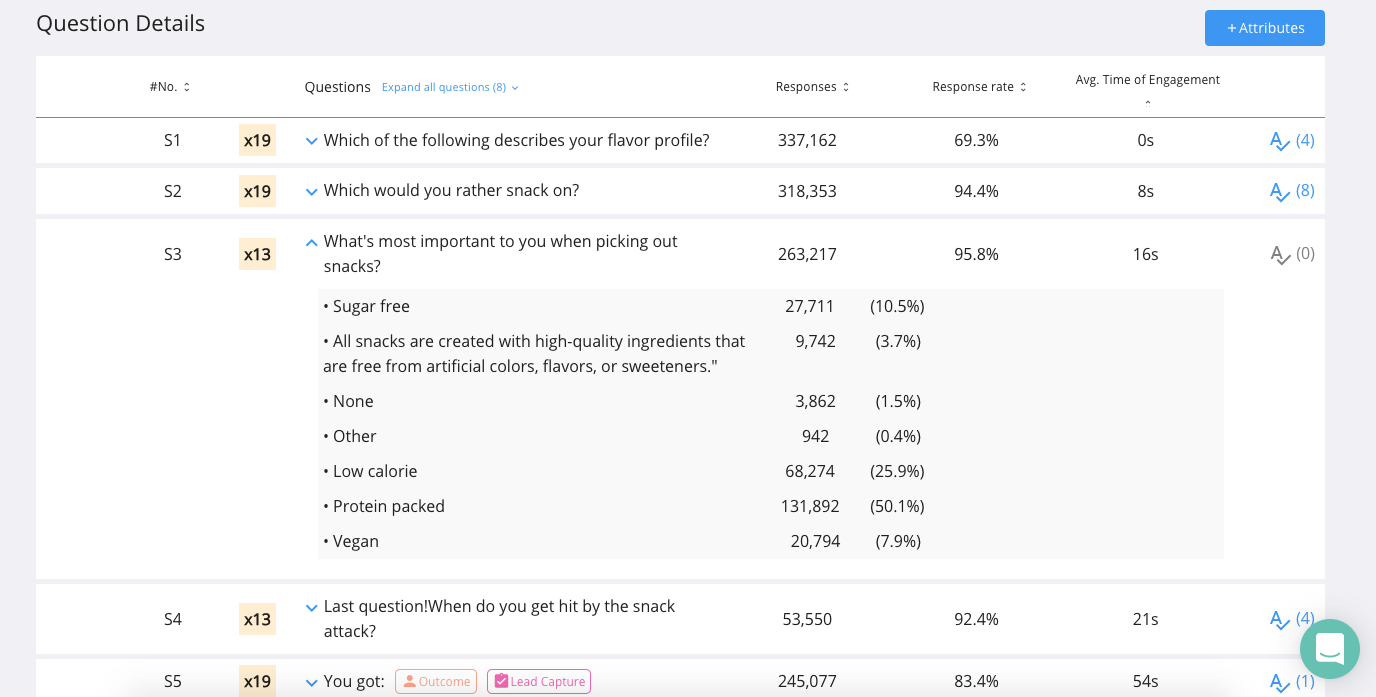
Scroll down the page and you’ll see Question Details, a list of each individual question screen. If you expand a question, you will see the breakdown of responses to that question, as well as screen response rate and average time of engagement on that individual screen.
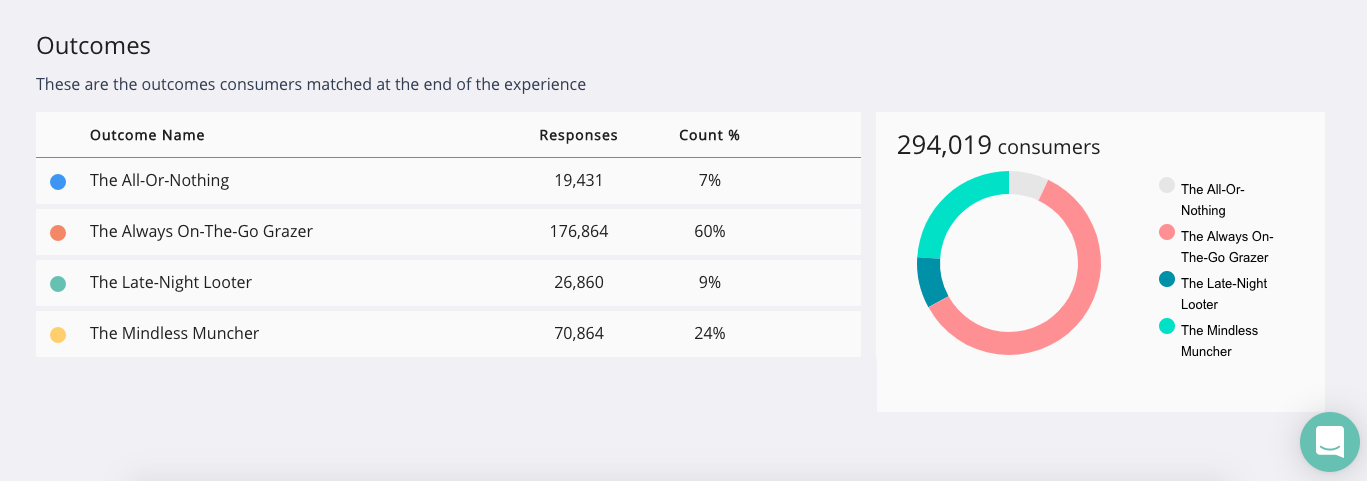
At the bottom of the page, you will find the outcome breakdown. This shows the total number of consumers that completed the experience and reached an outcome. A chart displays a breakdown of which outcomes users received.
Frequently Asked Questions
Q: How quickly does data populate onto the Jebbit dashboards?
A: It typically takes about five minutes for data from a user session to populate onto the dashboards. However, you may notice that data is available in your exports sooner than your dashboards, so you can try exporting to review your data faster!
Related Articles
Keywords: question data, export data, response data