
This article will help you understand how to interpret Lightbox Analytics in particular. Most of the metrics that are available for your Lightbox unit look just like metrics that are available for your standard or immersive Jebbit experiences, but there are some nuances when looking at the data for Lightbox units.
Step-by-step Guide
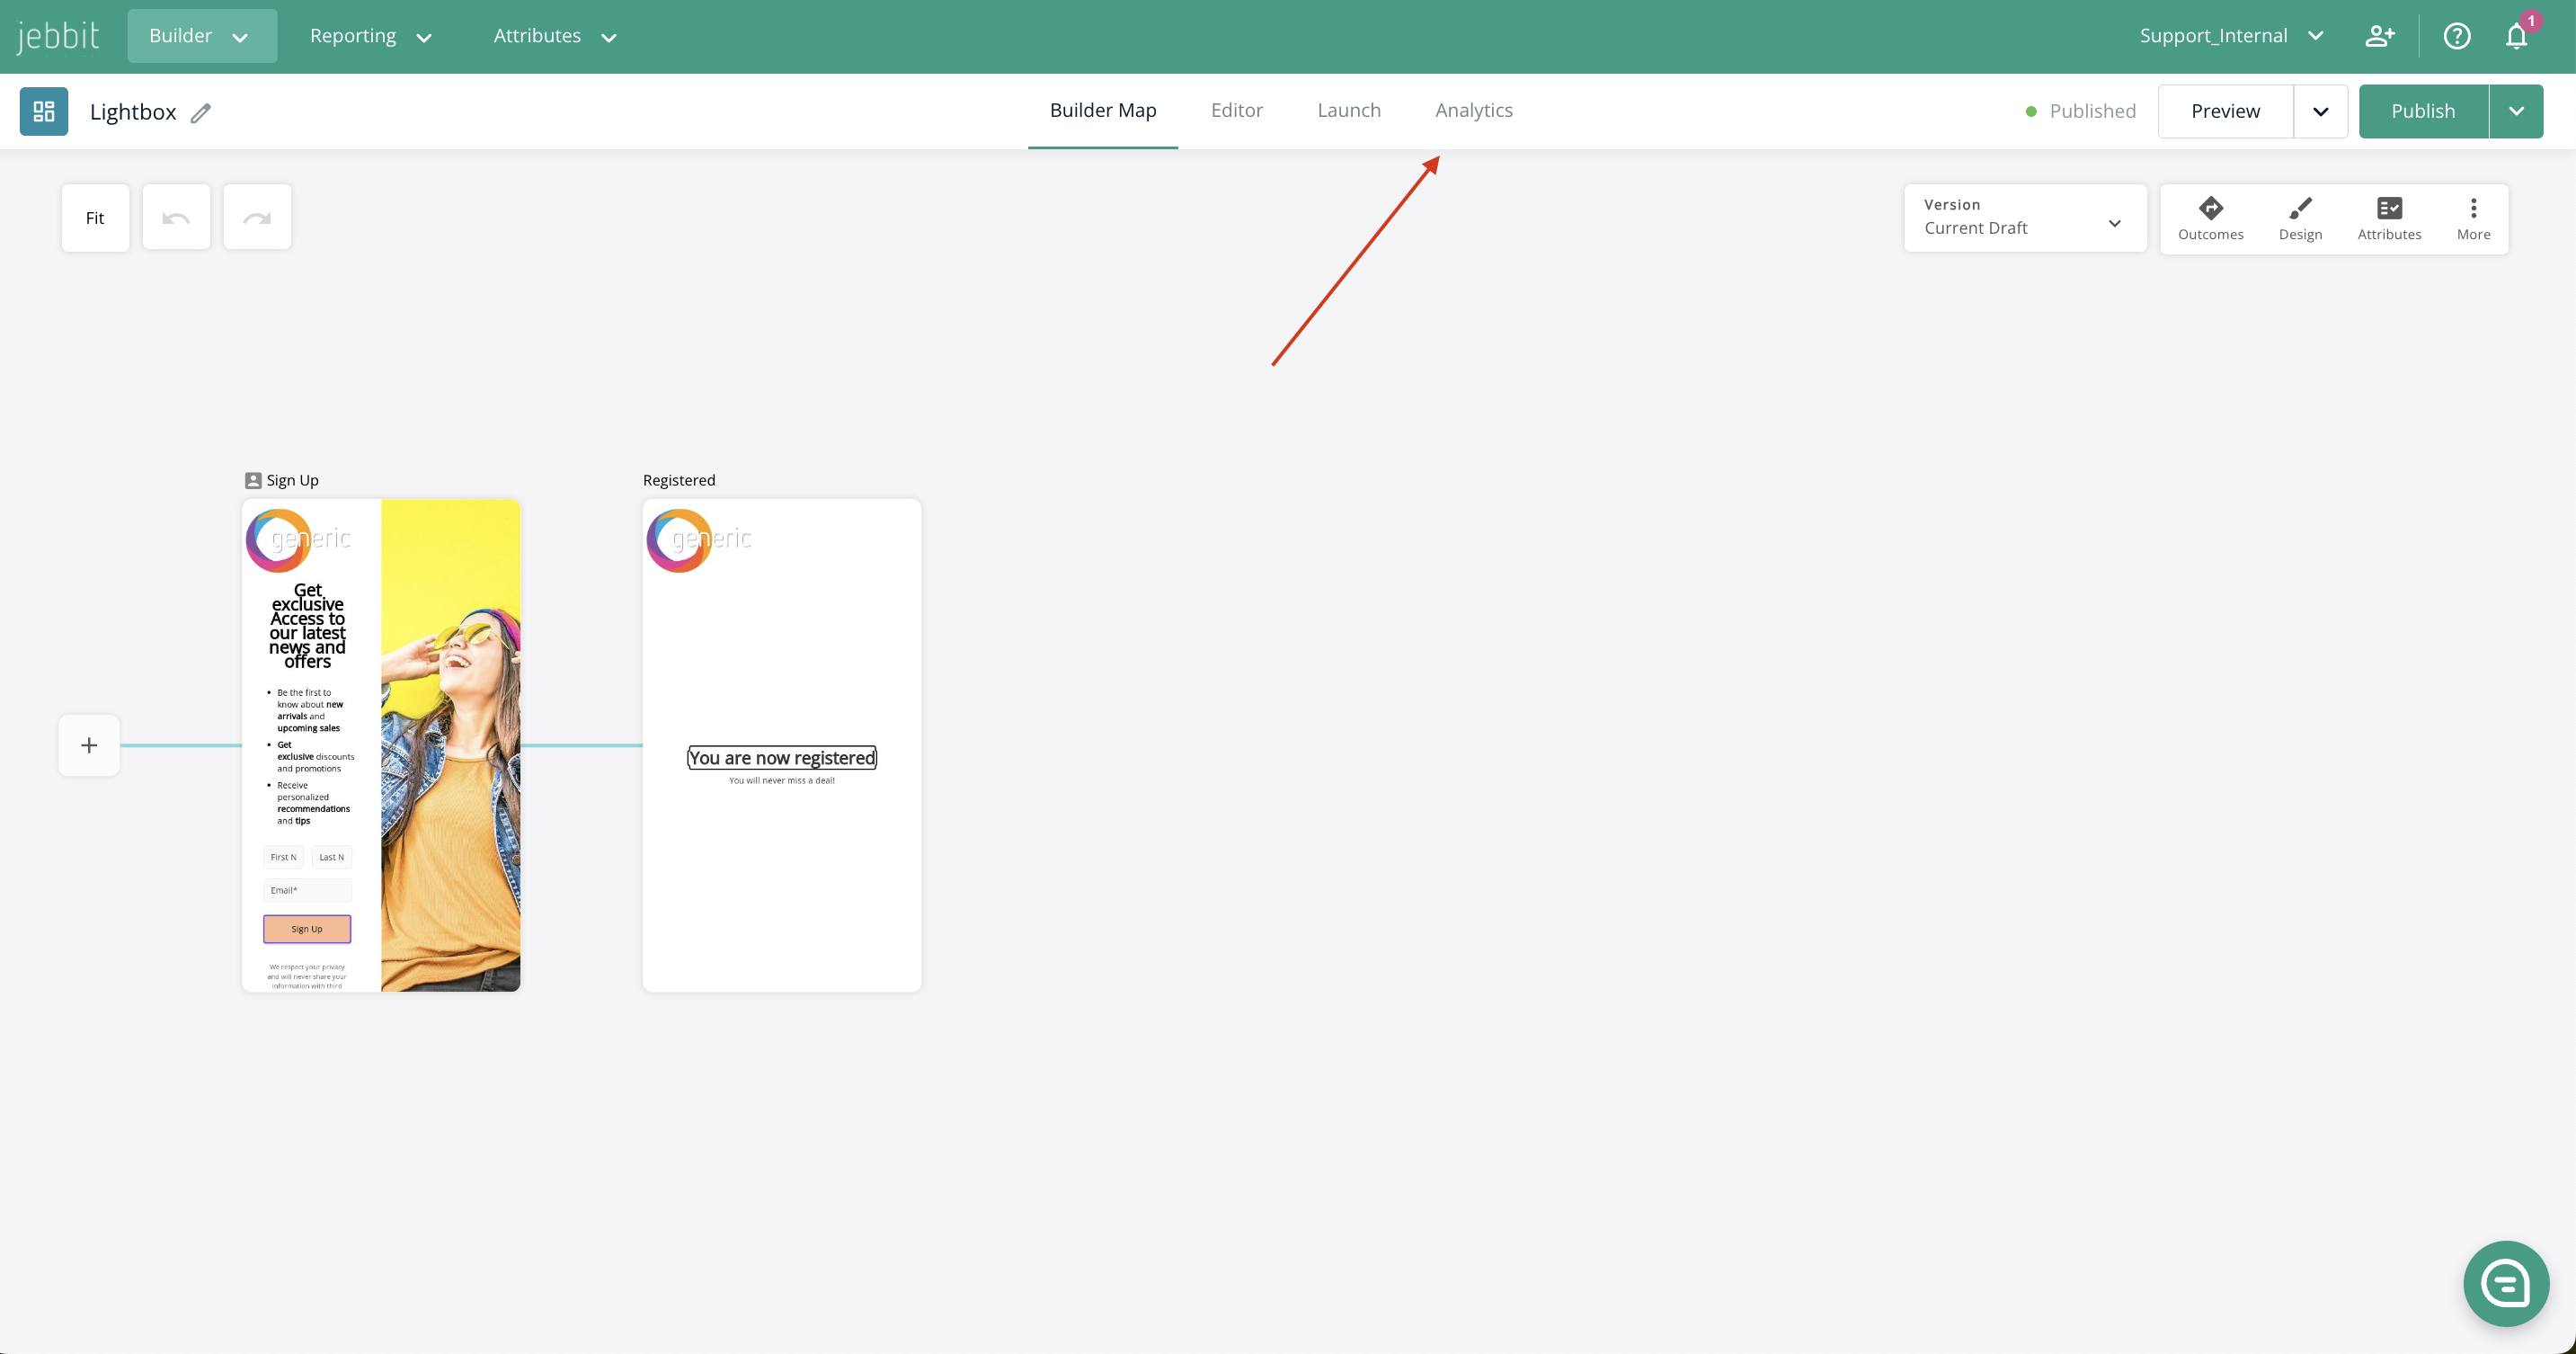
First, dive into the "Analytics" tab in the builder map of the Lightbox.

You can dive into the different analytic sections to get more detailed metrics.

The screenshot below is an example of what your Lightbox metrics will look like. Keep reading to understand what each metric tracks!

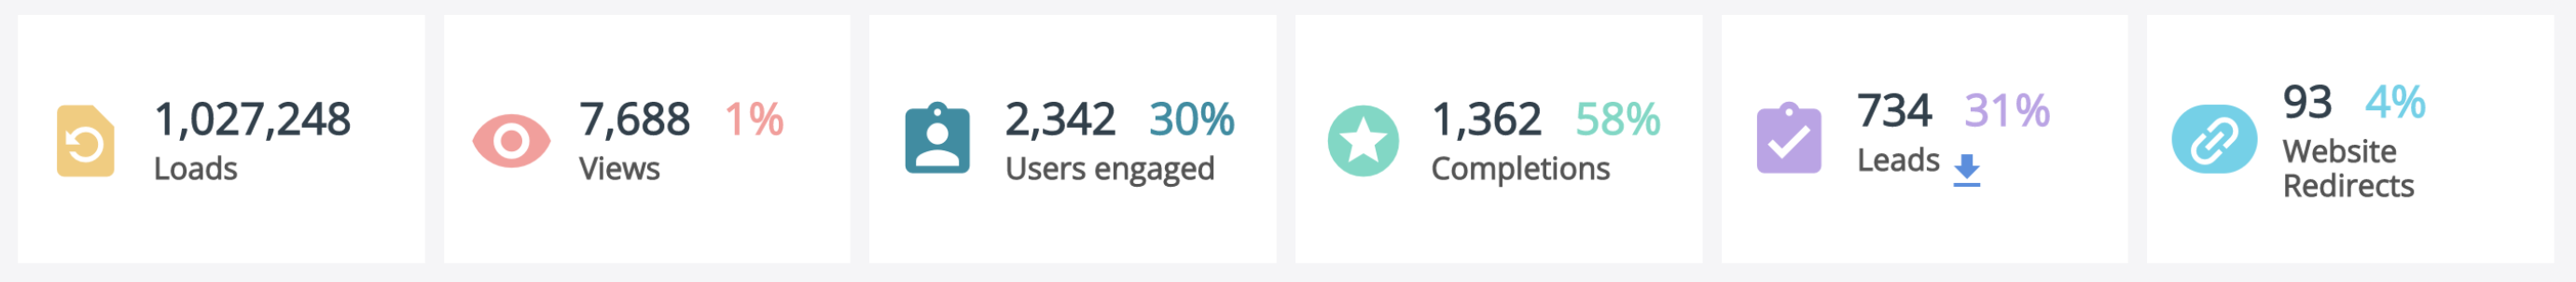
Loads: A Load is counted every time a visitor lands on a webpage where the Jebbit Global Code Snippet is placed. Notably, this does not mean that a visitor actually saw the Lightbox, just that the snippet was loaded behind the scenes. The code snippet loads instantly as soon as your webpage does. This number should be roughly equal to the total amount of page views you see.
Views: A View is counted when a user actually sees/views your Lightbox. There are many reasons why your Lightbox has more loads than views. For instance, if you set your Lightbox to trigger at a scroll depth of 50%, and a visitor leaves your page without scrolling 50%, the Lightbox will have technically loaded, but it will not count as a View. In order for a View to count, the Lightbox has to be visible on a visitor's screen.
Users Engaged: An Engagement gets counted when a user clicks on the first button of your Lightbox experience.
Completion: A Completion is counted when a user finishes all screens of your experience, or reaches the Completion point that you've set manually.
Leads: A Lead is counted when a user inputs their lead information (email, phone, etc).
Website Redirect: A Redirect is counted when a user is redirected from the Jebbit experience to another page on your site.
Frequently Asked Questions
Q: Why don't I see the Loads metric for my Lightbox unit?
A: If there is no significant difference between a Loads and Views, then we will only show the Views metric. This situation is likely to happen if you have your Lightbox set to deploy on Page Load.
Q: Why don't I see a Lead Capture metric for my Lightbox unit?
A: This stat will only show if you have a Lead Capture screen included in your experience.
Q: Why don't I see a Website Redirect metric for my Lightbox unit?
A: This stat will only show if you have a Redirect URL set up at the end of your experience.
Q: The number of Views seems too low compared to the number of Loads in my dashboard.
A: Views is a new metric that we started tracking on Nov 15, 2023. If you had an experience live before this date, your Views number may look low in comparison to your total Loads. Checking your analytics date from Nov 15 onward will give you a clean look at all your data together!
If the above does not apply to you, then another reason why Views may seem low compared to Loads is because a Load is counted when a page on your site that has the Global Snippet Code is loaded. If your Lightbox is not set to trigger on Page Load, then this can result in less Views than Loads.