
Stack rank allows you to ask your audience to rank items in accordance with their preference: for example, what is your favorite charcuterie board item?
Video Tutorial
Step by Step Guide
To add, go to 'Add Elements', and choose 'Stack Rank' under the Response Types section.
To add/remove choices, select a currently displayed choice/button and click on the appropriate action in the toolbar.

Design the style of your buttons in the lefthand control panel.
Preview to ensure everything is working properly.
Frequently Asked Questions
Q: How do you incorporate Stank Rank into Outcome Logic?
A: In this example, we are mapping the question "Rank your favorite colors." There are 4 choices for an end-user to rank from.
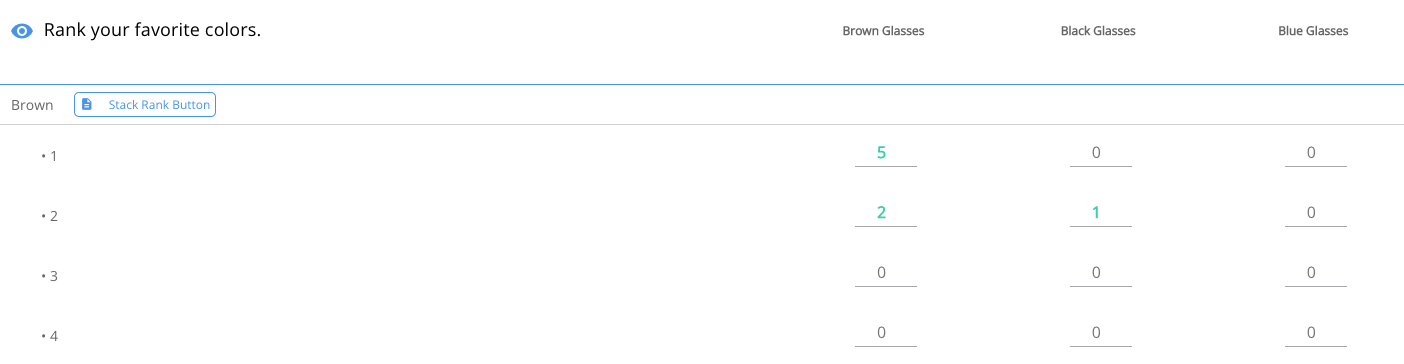
Notice that each response, (in the example above 'brown') has an associated amount of positions. The numbers shown above to the left (1, 2, 3, 4) represent where someone from your audience has ranked that specific response.
If a high ranking is correlated with a certain product/outcome, you should score that ranking highly under the appropriate outcome.
Q: How do you incorporate Stank Rank into Dynamic Product Feed Logic?
A: In this example, we are mapping the question "Rank your favorite colors." There are 4 choices for an end-user to rank from.

Notice that each response ('purple' above) has an associated amount of positions. The numbers shown above to the left (1, 2, 3, 4) represent where someone from your audience has ranked that specific response.
If a high ranking is correlated with a certain product category, then you should place the characteristic of that category on the same line as position value.
In the above example, I've associated 'purple' products with everyone who ranked 'purple' in their top two choices.
Q: How will Stack Rank responses look in the reporting dashboard?
A: Let's look at this analytics page and break down what we are seeing.

The Question: 'Who is the best dancer at Jebbit?' (same format as all analytics)
The 3 choices shown represent the 3 choices presented to the end user.
Average position = sum of all positions / total submissions
It gives you an understanding of where things are ranked on average - lower average position numbers mean the choice was ranked highly
For instance, the math on the above example for Michael Marcus is: 3 + 3 + 3 / 3 = 3
The '3 + 3 + 3' are the individual responses users have given
the '/3' = 'divided by total number of submissions' - in this case, there were 3 submissions so we divided by 3